IR-Spektroskopie
Infrared Spectroscopy (IR Spectroscopy)
Summary
In this practical, you will deepen your understanding of molecular vibrations and rotations by using a modern Fourier-Transform Infrared (FTIR) spectrometer. You will prepare and analyze different types of samples (solid, liquid, gas) and learn not only how to measure IR spectra, but also how to interpret them quantitatively and qualitatively. The aim is for you to gain hands-on experience with IR spectral features, resolution effects, and their relation to molecular structure and physical constants.
What You Will Do
- Prepare solid (films, pellets), liquid, and gaseous samples for IR spectroscopy.
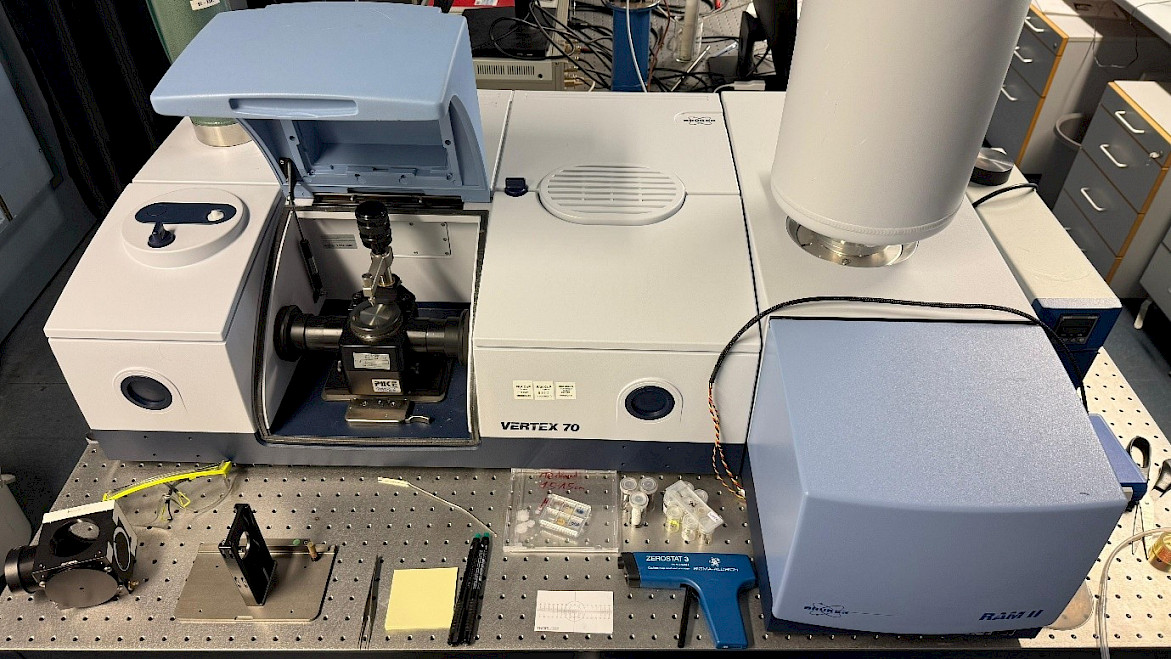
- Handle and operate a modern FTIR spectrometer (e.g., Bruker Vertext 70) under supervision.
- Record background spectra and sample spectra with different resolutions (e.g., 1, 4, and 32 cm⁻¹) to see how resolution affects spectral detail.
- Use transmission, ATR, and gas cell techniques; pay special attention to sample preparation (e.g., using NaCl windows) and instrument cleanliness.
- Analyze your spectra: assign peaks (vibrational & rotational bands), apply the Lambert–Beer Law (e.g., using a dilution series), and evaluate quantitative aspects where possible.
- Discuss and identify common sources of error that may distort the spectra (e.g., contamination, moisture, instrumental drift, window degradation).
Detailed Experimental Work
- Polystyrene Film
Record spectra in the range ~ 4000–450 cm⁻¹. Measure at 1, 4, 32 cm⁻¹ resolution. Observe how fine structure and peak shapes change with resolution. - Gas Phase – HCl
Use a gas cell with NaCl windows; record vibrational-rotational spectrum. Identify P, Q, R branches; resolve isotopic splitting if possible (using 1 cm⁻¹ resolution). Compute constants (vibrational frequency, rotational constants, bond length, etc.). - NH₃ (Ammonia) Gas
Measure IR spectrum; observe inversion splitting (umbrella mode) and discuss symmetry and tunnelling effects. - Atmospheric Absorption
Record the spectrum of the ambient atmosphere. Do not use CO₂/H₂O suppression initially. Observe absorption bands of H₂O and CO₂; identify IR windows (~8-12 µm). - Liquid Samples / Fermi Resonance
Work with acetonitrile (and the deuterated version) to observe Fermi resonance. Also record tetrachloroethene, compare IR to Raman. - Quantitative Analysis with Lambert-Beer Law
Prepare a series of acetone solutions of known concentrations. Record their IR spectra; plot absorbance vs. concentration to test the linearity and determine molar absorptivity.
What You Will Learn
- How molecular structure (types of functional groups, masses, bond strengths) determines IR absorption frequencies.
- The effect of spectral resolution on obtaining fine detail in spectra.
- How to handle delicate components (e.g. NaCl windows) and avoid artifacts.
- Quantitative analysis using Lambert-Beer Law.
- Interpretation of spectra: vibrational modes, rotational fine structure, Fermi resonances, atmospheric absorption features.